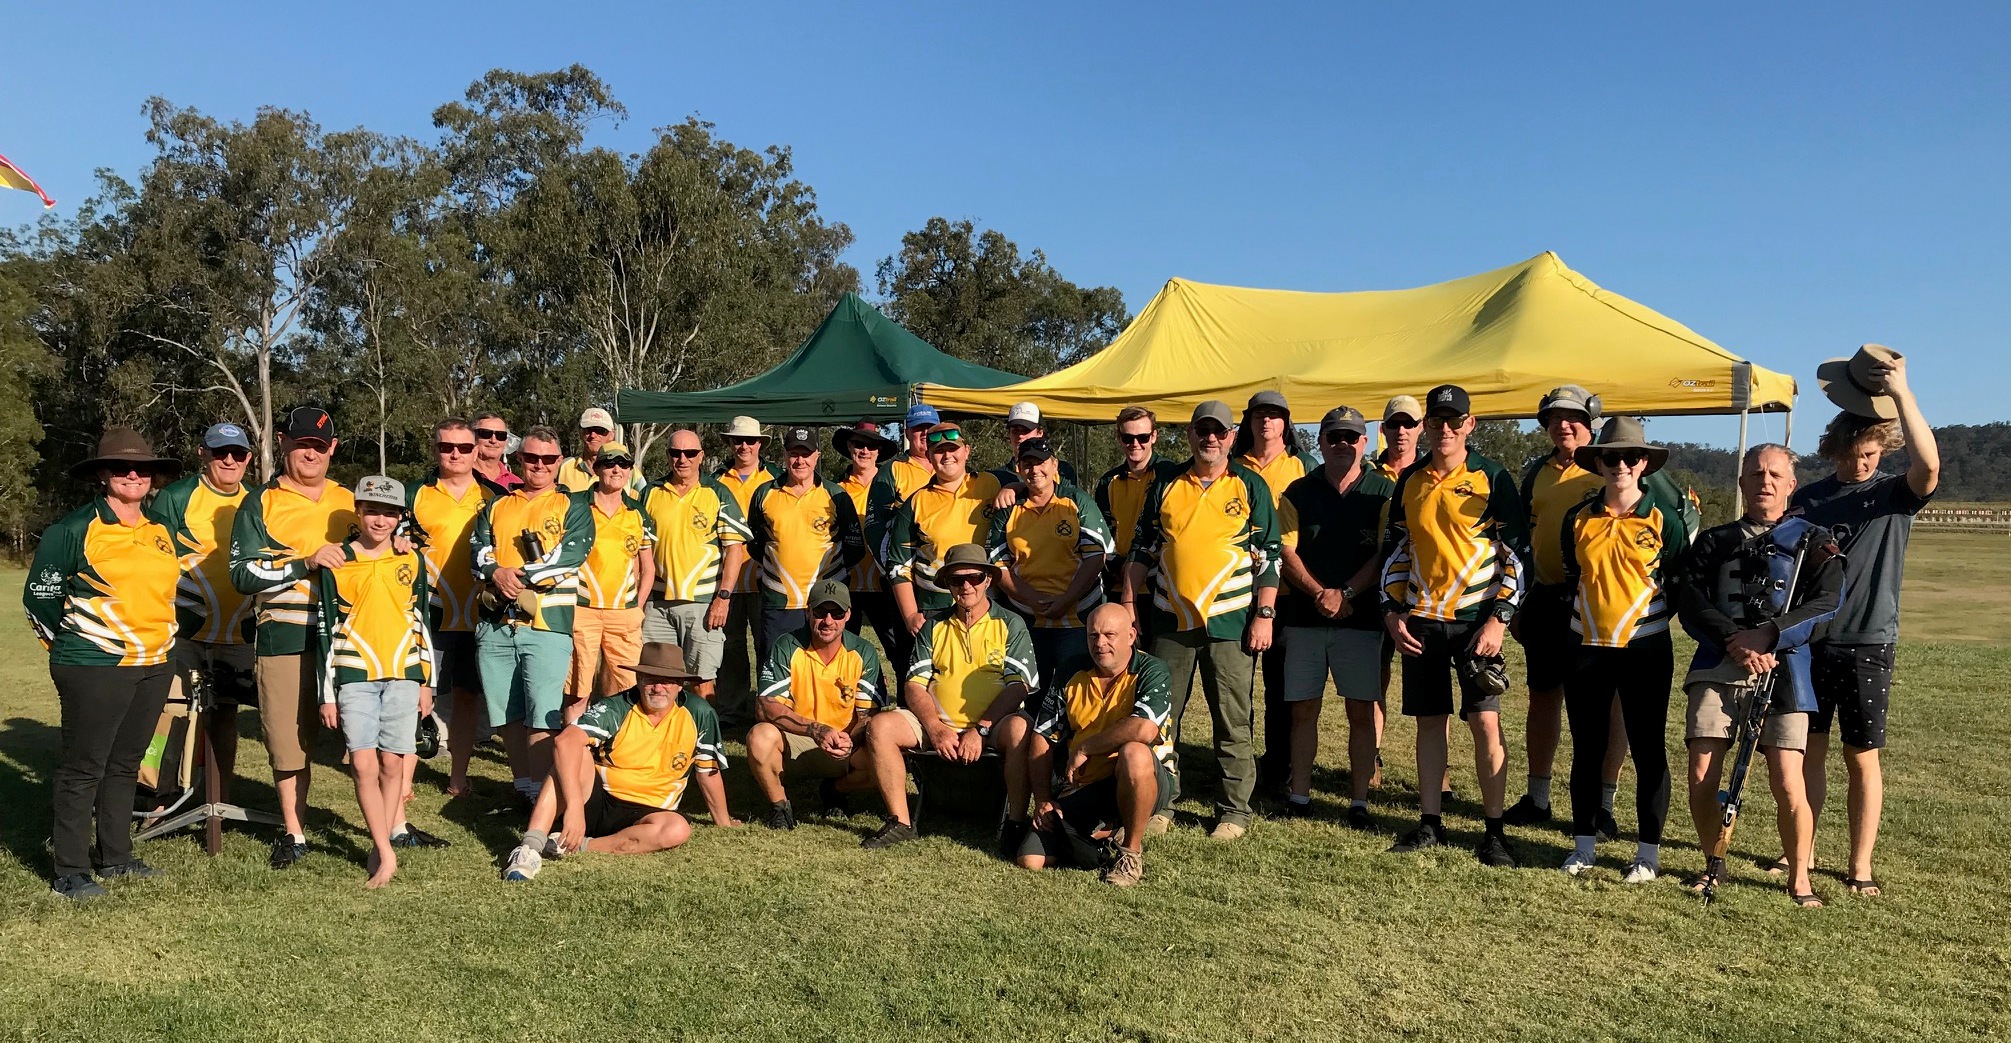
Natives Target Rifle Division 1 Team had a 13 point win over arch-rival, Pacific Club, at today’s 900 yard Fixtures match. The Natives team now has a comfortable lead over the Albert/Central Club and Pacific with only the challenging 1000 yards Fixtures match yet to come for the annual trophy.
| Date: | 9/10/21 | |||||||||
| Range: | 900 Fix | |||||||||
| Name: | Link to Groups | Grade 2021 | ||||||||
| Crawford, Bob | Click | A | 149.14 | TR TEAMS | ||||||
| O’Loghlen, Kim | Click | A | 149.11 | Division 1 | ||||||
| Brinin, Isaac | Click | C | 148.14 | 1st | Natives: | |||||
| Thompson, Don | Click | A | 148.10 | B Crawford | 149.14 | |||||
| Pratt, Joshua | Click | A | 147.15 | K O’Loghlen | 149.11 | |||||
| Errington, Ian | Click | C | 146.14 | J Pratt | 147.15 | |||||
| Spence, James | Click | A | 146.10 | J Crawford | 145.19 | |||||
| Crawford, Jessica | Click | A | 145.19 | M Teglasi | 143.15 | |||||
| Mueller, Rudi | Click | B | 144.13 | 733.74 | ||||||
| Teglasi, Mirko | Click | A | 143.15 | 2nd | Pacific | 727.63 | ||||
| Pitt, Reilly | Click | C | 143.09 | 3rd | Albert/Central | 720.59 | ||||
| Caske, John | Click | B | 139.07 | 4th | University | DNS | ||||
| Latham, Wendy | Click | B | 138.08 | Division 2 | ||||||
| Meldrum, Craig | Click | A | 138.06 | 1st | Pacific | 731.60 | ||||
| Hodson, Tim | Click | C | 136.07 | 2nd | Mariners | 725.49 | ||||
| Halpin, Michael | Click | B | 136.05 | 3rd | Natives: | |||||
| Spence, Teddy | Click | C | 135.10 | D Thompson | 148.10 | |||||
| Canty, Marcia | Click | C | 134.08 | J Spence | 146.10 | |||||
| Bell, Robert | Click | B | 132.04 | R Mueller | 144.13 | |||||
| Thomas, Warrick | Click | C | 94.03 | J Caske | 139.07 | |||||
| Thomas, Clancy | Click | C | 48.02 | W Latham | 138.08 | |||||
| F/TR | Scope | C Meldrum | 138.06 | |||||||
| Pratt, Craig | Click | F/TR | 170.12 | M Halpin | 136.05 | |||||
| Stevens, John | Click | F/TR | 166.07 | 715.48 | ||||||
| Clarkson, Brett | Click | F/TR | 166.06 | 4th | Albert/Central | 683.41 | ||||
| F-Class Open | Scope | Division 3 | ||||||||
| Kelly, Danny | Click | FO | 169.10 | 1st | Natives: | |||||
| Ploch, Oliver | Click | FO | 163.06 | I Brinin | 148.14 | |||||
| F-Class Standard | Scope | I Errington | 146.14 | |||||||
| Latham, Wayne | Click | FSA | 170.06 | R Pitt | 143.09 | |||||
| Ward, David | Click | FSB | 168.04 | T Hodson | 136.07 | |||||
| Menzel, John | Click | FSB | 166.05 | T Spence | 135.10 | |||||
| Ward, Michael | Click | FSB | 162.09 | M Canty | 134.08 | |||||
| Morley, Scott | Click | FSB | 162.04 | R Bell | 132.04 | |||||
| Crawford, Kristine | Click | FSA | 159.04 | W Thomas | 94.03 | |||||
| Blair, Wayne | Click | FSA | 159.03 | C Thomas | 48.02 | |||||
| Pickles, Brian | Click | FSA | 158.05 | 437.37 | ||||||
| 2nd | Mariners | 409.19 | ||||||||
| 3rd | Pacific | 380.22 | ||||||||
| Pennants | Pts | Score | ||||||||
| Natives | 5 | 590.59 | F-CLASS TEAMS | |||||||
| Pacific | 4 | 585.58 | Division 1 | |||||||
| Albert/Central | 3 | 583.50 | 1st | Pacific | 754.60 | |||||
| Mariners | 2 | 582.41 | 2nd | Natives Cassowaries: | ||||||
| University | 0 | DNS | C Pratt | 170.12 | ||||||
| W Latham | 170.06 | |||||||||
| D Kelly | 169.10 | |||||||||
| J Stevens | 166.07 | |||||||||
| K Crawford | 159.04 | |||||||||
| W Blair | 159.03 | |||||||||
| 666.20 | ||||||||||
| 3rd | Mariners | 656.80 | ||||||||
| 4th | Albert/Central | 607.93 | ||||||||
| Brisbane | DNS | |||||||||
| Natives Dingoes | DNS | |||||||||
| Division 2 | ||||||||||
| 1st | Pacific | 748.87 | ||||||||
| 2nd | Natives Wombats: | |||||||||
| D Ward | 168.04 | |||||||||
| B Clarkson | 166.06 | |||||||||
| J Menzel | 166.05 | |||||||||
| O Ploch | 163.06 | |||||||||
| M Ward | 162.09 | |||||||||
| S Morley | 162.04 | |||||||||
| B Pickles | 158.05 | |||||||||
| 642.03 | ||||||||||
| Mariners | DNS | |||||||||
| Composite Teams | ||||||||||
| 1st | University | 439.81 | ||||||||
| 2nd | Gold Coast | 379.65 | ||||||||
| Brisbane | DNS | |||||||||
| Aggregate | 300 Fix | 800 Fix | 400 Fix | 500 Fix | 700 Fix | 600 Fix | 900 Fix | ||
| to Date | 20/02/21 | 27/03/21 | 24/04/21 | 26/06/21 | 24/07/21 | 11/09/21 | 9/10/21 | ||
| O’loghlen, Kim | 1038.103 | 149.019 | 150.015 | 148.010 | 150.024 | 144.009 | 148.015 | 149.011 | |
| Pratt, Joshua | 1037.128 | 150.022 | 147.019 | 149.025 | 150.022 | 146.003 | 148.022 | 147.015 | |
| Thompson, Don | 1027.099 | 149.018 | 147.014 | 150.020 | 148.021 | 140.006 | 145.010 | 148.010 | |
| Spence, James | 1007.072 | 138.008 | 148.011 | 149.018 | 145.011 | 137.003 | 144.011 | 146.010 | |
| Meldrum, Craig | 994.070 | 143.009 | 145.011 | 145.009 | 146.017 | 139.012 | 138.006 | 138.006 | |
| Errington, Ian | 922.049 | 93.002 | 135.009 | 137.005 | 143.010 | 127.001 | 141.008 | 146.014 | |
| Pitt, Reilly | 918.043 | 98.007 | 134.009 | 134.002 | 141.007 | 132.001 | 136.008 | 143.009 | |
| Bell, Robert | 917.057 | 91.005 | 144.013 | 145.011 | 145.013 | 121.002 | 139.009 | 132.004 | |
| Mueller, Rudi | 872.075 | 148.018 | 145.014 | 146.009 | 146.010 | 143.011 | 144.013 | ||
| Latham, Wendy | 860.063 | 146.013 | 146.012 | 145.012 | 140.008 | 145.010 | 138.008 | ||
| Canty, Marcia | 841.044 | 95.004 | 141.010 | 66.004 | 147.012 | 123.001 | 135.005 | 134.008 | |
| Halpin, Michael | 836.051 | 137.011 | 145.010 | 142.009 | 133.003 | 143.013 | 136.005 | ||
| Brinin, Issac | 796.048 | 95.002 | 144.013 | 144.009 | 132.003 | 133.007 | 148.014 | ||
| Hodson, Tim | 752.042 | 97.008 | 143.012 | 127.010 | 116.002 | 133.003 | 136.007 | ||
| Smith, Steve | 731.071 | 146.016 | 149.019 | 148.016 | 144.007 | 144.013 | |||
| Baker, Luke | 716.058 | 146.015 | 149.015 | 145.011 | 142.011 | 134.006 | |||
| Spence, Teddy | 688.041 | 134.006 | 140.008 | 138.007 | 141.010 | 135.010 | |||
| Crawford, Jessica | 588.069 | 149.022 | 147.013 | 147.015 | 145.019 | ||||
| Crawford, Bob | 445.054 | 148.022 | 148.018 | 149.014 | |||||
| Lusty, Tim | 438.031 | 146.013 | 146.009 | 146.009 | |||||
| Whalan, Domonic | 286.017 | 141.008 | 145.009 | ||||||
| Caske, John | 274.014 | 135.007 | 139.007 | ||||||
| Thomas, Warwick | 224.006 | 130.003 | 94.003 | ||||||
| Thomas, Clancy | 174.006 | 126.004 | 48.002 | ||||||
| Heald, Karen | 144.013 | 144.013 | |||||||
| Teglasi, Mirko | 143.015 | ||||||||
| F-Class | |||||||||
| Stevens, John | 1198.082 | 175.013 | 179.022 | 177.014 | 177.012 | 151.002 | 173.012 | 166.007 | |
| Blair, Wayne | 1176.081 | 172.015 | 177.020 | 175.020 | 177.012 | 142.002 | 174.009 | 159.003 | |
| Pickles, Brian | 1153.043 | 176.009 | 167.007 | 155.008 | 171.004 | 159.004 | 167.006 | 158.005 | |
| Ploch, Oliver | 1148.043 | 169.010 | 162.006 | 166.010 | 163.002 | 159.002 | 166.007 | 163.006 | |
| Morley, Scott | 1110.031 | 153.003 | 159.004 | 164.007 | 166.005 | 150.005 | 156.003 | 162.004 | |
| Latham, Wayne | 1030.063 | 178.014 | 178.008 | 177.017 | 159.007 | 168.011 | 170.006 | ||
| Ruthven, Brad | 1027.059 | 177.015 | 175.015 | 177.010 | 174.014 | 152.002 | 172.003 | ||
| Craick, Gordon | 1014.060 | 174.011 | 175.012 | 171.012 | 176.015 | 151.003 | 167.007 | ||
| Menzel, John | 999.042 | 171.006 | 166.006 | 170.013 | 171.010 | 155.002 | 166.005 | ||
| Constantinou, George | 871.067 | 180.016 | 178.019 | 171.013 | 166.008 | 176.011 | |||
| Clarkson, Brett | 854.048 | 175.009 | 178.015 | 177.013 | 158.005 | 166.006 | |||
| Tez, Jakub | 824.040 | 173.012 | 176.013 | 168.007 | 141.002 | 166.006 | |||
| Ward, David | 814.025 | 161.007 | 170.010 | 147.003 | 168.001 | 168.004 | |||
| Ward, Michael | 647.023 | 155.004 | 169.004 | 161.006 | 162.009 | ||||
| Kansky, Andy | 509.025 | 174.007 | 163.008 | 172.010 | |||||
| Berry, Catherine | 499.028 | 169.010 | 177.014 | 153.004 | |||||
| Crawford, Kristine | 492.025 | 178.017 | 155.004 | 159.004 | |||||
| Wardrop, Jeremy | 490.025 | 165.011 | 170.009 | 155.005 | |||||
| Pratt, Craig | 346.021 | 176.009 | 170.012 | ||||||
| Menzel, Paul | 330.012 | 166.009 | 164.003 | ||||||
| Greaves, Brian | 308.009 | 167.007 | 141.002 | ||||||
| Kansky, Rhys | 307.008 | 145.001 | 162.007 | ||||||
| Mitchell, Scott | 175.010 | 175.010 | |||||||
| Kelly, Danny | 169.010 | 169.010 | |||||||
| Hedges, Allen | 128.002 | 128.002 | |||||||
| MDRA FIXTURES PROGRESSIVE RESULTS 2021 | |||||
| Points | Score | ||||
| Division 1: | |||||
| 1 | Natives | 24 | 5156.570 | ||
| 2 | Albert/Central | 20 | 5120.482 | ||
| 3 | Pacific | 19 | 5110.509 | ||
| 4 | University | 4 | 2735.168 | ||
| Division 2: | |||||
| 1 | Brisbane Mariners | 25 | 5096.441 | ||
| 2 | Natives | 17 | 5030.372 | ||
| 3 | Pacific | 16 | 5032.385 | ||
| 4 | Albert/Central | 12 | 4944.324 | ||
| Division 3: | |||||
| 1 | Natives | 18 | 2843.195 | ||
| 2 | Pacific | 12 | 2700.148 | ||
| 3 | Brisbane Mariners | 12 | 2616.138 | ||
| F-Class Division 1: | |||||
| 1 | Pacific | 38 | 5487.00 | ||
| 2 | Natives Cassuaries | 34 | 5274.98 | ||
| 3 | Albert/Central | 29 | 5150.44 | ||
| 4 | Brisbane Mariners | 17 | 4787.17 | ||
| 5 | Brisbane | 14 | 3583.20 | ||
| 6 | Natives Dingoes | 11 | 3506.63 | ||
| F-Class Division 2: | |||||
| 1 | Natives | 18 | 4624.28 | ||
| 2 | Pacific | 17 | 4499.17 | ||
| 3 | Brisbane Mariners | 3 | 1559.43 | ||
| Composite: | |||||
| 1 | Gold Coast | 15 | 3383.73 | ||
| 2 | Brisbane | 15 | 2716.68 | ||
| 3 | University | 10 | 2947.39 | ||
| PENNANT PROGRESSIVE SCORES 2021 | |||||
| 1 | Natives | 28 | 4141.470 | ||
| 2 | Pacific | 28 | 4118.423 | ||
| 3 | Albert/Central | 23 | 4113.398 | ||
| 4 | Brisbane Mariners | 20 | 4083.364 | ||
| 5 | University | 6 | 2794.194 | ||
")


